Statistical significance
A test of whether a difference is probably real or could just be luck.
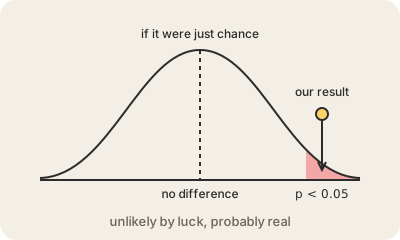
When you compare two groups, they almost never come out exactly equal, even if nothing real is going on. Flip a coin 100 times and you rarely get exactly 50 heads. Statistical significance is a way of asking: if there were truly no difference, how surprising would a result like this be?
That surprise is measured with a p-value: the probability of seeing a difference at least this big by chance alone, assuming there is no real effect. A small p-value means chance is an unlikely explanation. By a long-standing convention, many fields call a result significant when p is below 0.05, that is, when a gap this big would show up by luck less than 5% of the time. In an A/B test, it is what lets a team say the new checkout button really performs better, not just that it got lucky this week.
Significance is easy to misread. It does not mean the effect is large or important: with millions of users, a tiny difference can be significant and still not worth anything. It also does not prove the effect is real, since a 5% threshold means some flukes will pass. Running many tests and only reporting the ones that cross the line, sometimes called p-hacking, makes this much worse. Good practice is to decide the test in advance and report the size of the effect along with the p-value.
Keep in mind
- Asks how likely a result would be if there were no real effect.
- Measured with a p-value; p < 0.05 is a common convention, not a law.
- Significant does not mean big or important.
- Running many tests guarantees some false positives.