Cohort analysis
Comparing groups of users who started at the same time, to see how each one behaves.
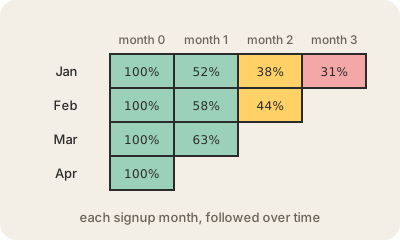
A cohort is a group of people who share a starting point: everyone who signed up in January, everyone who bought for the first time during a sale, every patient who began a treatment the same year. Cohort analysis follows each group over time and compares them, instead of lumping everyone together.
The classic output is a cohort table. Each row is a signup month. Each column is how many months have passed since signup. Each cell says what share of that cohort is still active. Reading across a row shows how one group fades. Reading down a column shows whether newer cohorts stick around better than older ones at the same age. Plot one row as a line and you get a retention curve.
The reason to do this is that totals hide what is going on. A company can grow its active users every month just by signing up more people, while each new group leaves faster than the last. Only by splitting users into cohorts do you see whether a product change, a price change or a new onboarding flow actually made people stay. It is a staple for subscription businesses, apps and anyone measuring churn.
Keep in mind
- A cohort is a group that shares a starting point, usually a signup date.
- The cohort table: rows are cohorts, columns are time since start.
- Reveals trends that overall totals hide.
- The standard way to measure retention and churn.