Power BI
Microsoft's tool for turning company data into interactive charts and reports.
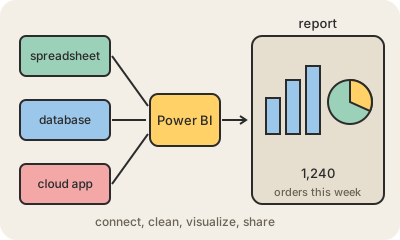
Power BI is Microsoft's business intelligence tool. It connects to where a company's data lives, such as Excel files, databases, Salesforce or SharePoint, cleans and combines it, and turns it into interactive reports and dashboards: charts you can click to filter, totals that update, maps, tables.
A typical workflow has two halves. An analyst builds the report in Power BI Desktop, a free Windows app: they pull in the data, shape it with Power Query (a step-by-step cleaning tool), define relationships between tables and write measures in a formula language called DAX. Then they publish it to the Power BI service in the cloud, where colleagues open it in a browser, Teams or the phone app, and it refreshes on a schedule.
Microsoft launched it as a standalone product in 2015, and it spread quickly in companies that already pay for Microsoft 365. Its main competitors include Tableau and Looker. Since 2023 it is also part of Microsoft Fabric, the company's broader analytics platform. For many office workers it is the next step after Excel: same instincts, but connected to live data and shared with the whole team.
Keep in mind
- Microsoft's BI tool for interactive reports and dashboards.
- Reports are built in Power BI Desktop and shared through the Power BI service.
- Power Query cleans the data; DAX defines calculations.
- Popular in companies already using Microsoft 365; competes with Tableau and Looker.