Data lineage
The map of where each piece of data came from and everything that depends on it.
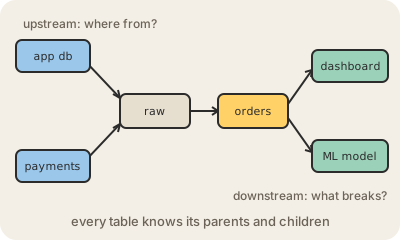
Data lineage is the record of how data moves and changes: which sources a table was built from, which jobs transformed it, and which tables, dashboards and models read it afterwards. It is usually drawn as a graph, with arrows going from raw sources on the left to reports on the right.
It answers two questions that come up every week in a data team. Looking upstream: "this revenue number looks wrong, where does it come from?" Looking downstream: "if I rename this column, what breaks?" Without lineage, both questions mean reading SQL and pipeline code by hand. With it, you click a table and see its ancestors and its descendants.
Lineage can be table-level (this table feeds that one) or column-level (this amount column is computed from those two columns), which is much more precise and much harder to capture. Modern tools build it automatically by parsing SQL or by having each job report what it read and wrote, often using the open standard OpenLineage. dbt draws lineage for its models, and data catalogs show it next to each table. It also matters for compliance: if a customer asks to be deleted under GDPR, lineage shows every place their personal data ended up.
Keep in mind
- Upstream lineage explains where a number comes from; downstream shows what a change will break.
- Column-level lineage is more useful than table-level, and harder to collect.
- Usually gathered automatically by parsing SQL or from jobs that report their inputs and outputs.
- OpenLineage is an open standard for sharing lineage between tools.