AWS Cost Explorer
The AWS screen that shows what you spent, on what, and what you will likely spend.
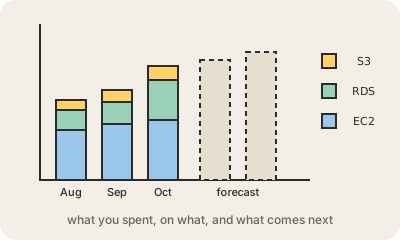
AWS Cost Explorer is the tool inside the AWS console for looking at your bill as charts instead of line items. It answers questions like: how much did we spend last month, which service grew the most, which team or project is behind that jump.
You can group and filter spending by service, account, region or tag, and switch between daily and monthly views. It keeps up to the last 13 months of history and forecasts up to the next 18 months based on your trend. It also includes reports on Reserved Instances and Savings Plans, the discounts you get by committing to a level of usage, and recommendations on what to buy.
Using it in the console is free; the API, for pulling the data into your own tools, charges a small fee per request. The data refreshes at least once a day, so it is good for spotting trends and surprises, not for watching costs minute by minute. It is often the first stop when someone asks why the AWS bill went up.
Keep in mind
- Charts your AWS costs by service, account, region or tag.
- Shows up to 13 months of history and a forecast of up to 18 months.
- Free in the console; the API charges per request.
- Data updates about once a day, not in real time.