Pivot table
A spreadsheet tool that summarizes a long list into totals by category, in a few clicks.
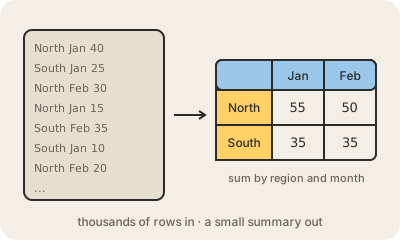
A pivot table takes a long list of records, like ten thousand rows of sales with date, region, product and amount, and summarizes it into a compact grid. You choose what goes in the rows (say, regions), what goes in the columns (months) and what to calculate in each cell (the sum of the amount). The result is a small table of totals that would take hours to build by hand.
The "pivot" part is that you can rearrange it instantly: drag product into the rows instead of region, switch the sum to an average or a count, add a filter for one year. Each change recalculates from the original data, which stays untouched. That makes it a great tool for exploring: you ask a question, look, and ask the next one.
Pivot tables are built into Excel, Google Sheets and LibreOffice, and they are often the first serious data analysis tool people learn. Under the hood they do the same thing as a GROUP BY query in SQL. When the data grows past what a spreadsheet handles comfortably, the same idea moves to databases and BI tools.
Keep in mind
- Summarizes many rows into totals grouped by categories.
- You pick rows, columns, the calculation and filters, and can rearrange them freely.
- The original data is never changed.
- It is the spreadsheet version of SQL's GROUP BY.