Observability
Being able to tell what a running system is doing, and why, from what it emits.
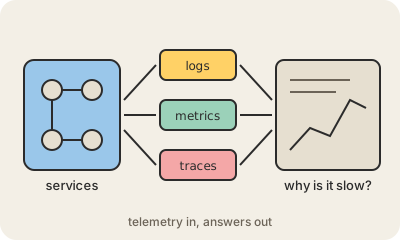
Observability is how well you can understand what is happening inside a running system just by looking at the data it sends out. With good observability, when users say checkout is slow you can find out which service, which request and which database query is to blame, without adding new code and redeploying first.
It rests on three kinds of signals. Logs are timestamped lines describing events ("payment 4812 failed: card declined"). Metrics are numbers measured over time, like requests per second, error rate or memory use. Traces follow a single request as it hops across many services, showing how long each step took. Together they are called telemetry.
Classic monitoring answers questions you thought of in advance: is the CPU above 90%? Observability aims to answer new ones, which matters in cloud systems made of dozens of microservices, where failures are often strange combinations nobody predicted. OpenTelemetry is the open standard most tools now use to collect these signals, and products like Amazon CloudWatch, Datadog or Grafana store and display them.
Keep in mind
- Understanding a system's inside from the data it emits.
- Three signals: logs (events), metrics (numbers over time), traces (one request's path).
- Monitoring checks known problems; observability helps with unknown ones.
- OpenTelemetry is the common open standard for collecting telemetry.