Data visualization
Turning numbers into pictures so patterns jump out.
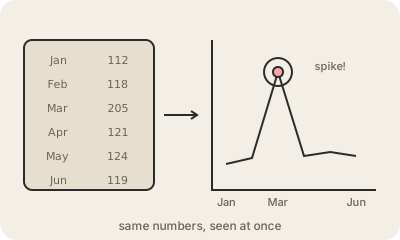
Data visualization is the practice of showing data as charts, maps and diagrams instead of rows of numbers. A table with 365 daily sales figures hides the story; the same numbers as a line make the Christmas spike and the January slump obvious in a second. Our eyes compare lengths, positions and colors much faster than they compare digits.
Each chart type answers a different question. Line charts show change over time. Bar charts compare categories. Scatter plots show whether two things move together, like ad spend and sales. Maps show where. Pie charts work only for a few parts of one whole, and are often a worse choice than a bar chart.
Good visualization is honest and simple: axes that start where they should, clear labels, color used for meaning rather than decoration, and one main message per chart. It is the visible end of a lot of data work, and it is what most people actually see, in dashboards, reports and the news. A misleading chart can spread a wrong idea faster than a wrong number in a table.
Keep in mind
- Shows data as charts and maps so patterns are seen, not calculated.
- Lines for time, bars for comparing, scatter for relationships, maps for place.
- One clear message per chart beats many crowded ones.
- Axis choices and color can make a chart honest or misleading.