Amazon QuickSight
AWS's tool for turning company data into charts and dashboards people can explore.
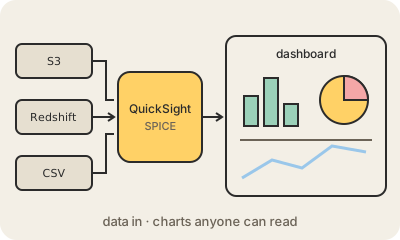
Amazon QuickSight is AWS's business intelligence service: it connects to your data, lets you build charts and dashboards, and shares them with the people who need them, in a browser, with nothing to install. A sales team can open a dashboard every morning and see revenue by region, filter by product and drill into last week, without writing SQL.
It reads from many sources: files in S3, databases in RDS, a Redshift data warehouse, Athena queries, spreadsheets, or outside tools like Salesforce. Data can be queried live or loaded into SPICE, QuickSight's in-memory engine, which makes dashboards fast and avoids hitting the source database every time someone clicks. Dashboards can also be embedded inside your own web app, so your customers see their own numbers.
Pricing is mostly per user, with readers paying less than authors who build dashboards, which makes it cheaper to spread across a large company than many classic BI tools. It has also added generative AI: you can type a question like "which store sold the most in March?" and get a chart back. In 2025 AWS folded it into a broader product, Amazon Quick, where it now appears as Quick Sight.
Keep in mind
- Serverless BI on AWS: dashboards in the browser, nothing to install.
- Connects to S3, Redshift, Athena, RDS, spreadsheets and SaaS tools.
- SPICE is its in-memory engine that keeps dashboards fast.
- Now part of Amazon Quick, under the name Quick Sight.